Introducing OpenTelemetry for Rivet Actors and Workflows
First-class OpenTelemetry tracing for Rivet Actors and Rivet Workflows, with ray IDs and span links that correlate work across actors that live for days.
Today we’re shipping first-class OpenTelemetry support for Rivet Actors and Rivet Workflows. Point an OTLP collector at your actors and you get automatic spans for everything they do.
- Long-running actors: every invocation is traced, even in an actor that has been alive for weeks
- Client-to-actor and actor-to-actor requests: one trace that follows a request through
c.client()calls - Workflows: each run is its own trace, linked to the run before it and correlated by ray ID
- SQLite queries: timing for every query, without recording SQL text, bindings, or results
Quickstart
Set an OTLP exporter on the process that runs your actors, next to RIVET_ENDPOINT, and redeploy:
OTEL_SERVICE_NAME=my-rad-app
OTEL_EXPORTER_OTLP_TRACES_ENDPOINT=http://collector:4318/v1/traces
OTEL_EXPORTER_OTLP_TRACES_PROTOCOL=http/protobuf
OTEL_EXPORTER_OTLP_TRACES_ENDPOINT is the feature flag. Once it’s set, spans named {actor}/{action} show up in your observability platform.
These are plain OTLP spans, so anything that speaks OTLP works: Jaeger, Tempo, Honeycomb, Grafana. There’s no Rivet-specific backend to run.
Actions, HTTP, and SQLite
Every action and raw HTTP handler becomes a span, with the work it did nested underneath: SQLite queries as rivet.sqlite.*, queue sends and receives, and scheduled actions. Failures carry error.type taken from your own UserError code, so you can group failures by business error rather than by stack trace.
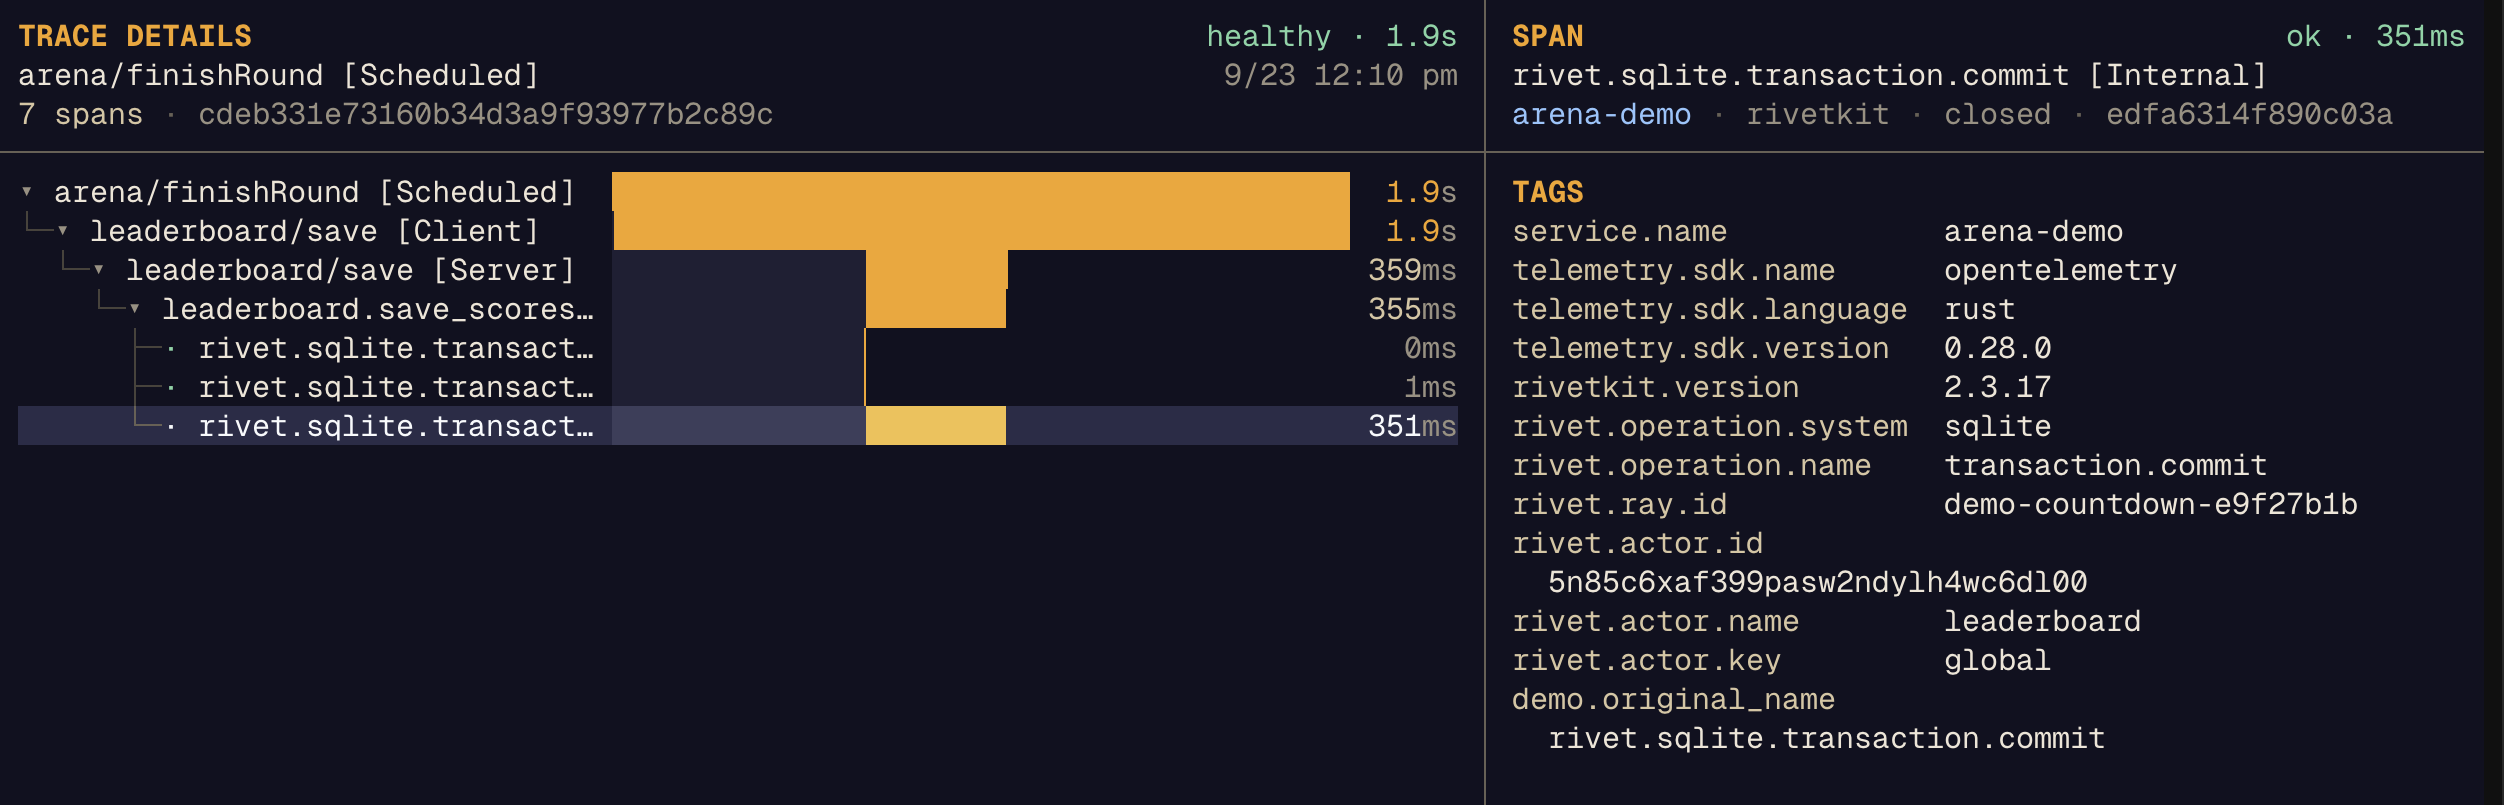
SQL text, bindings, results, action arguments, and actor state are never recorded.
Across actors and time
A trace assumes a discrete, short-lived unit of work. An HTTP request starts, does something, and ends, usually inside a few hundred milliseconds. Actors don’t work that way: they’re stateful and stay alive for days, handling invocations that have nothing to do with each other. A single span wrapping an actor’s lifetime would tell you nothing.
So each invocation is traced on its own, and two things stitch them back together. A call through c.client() stays in the caller’s trace, so you can see routing, waking the other actor, and retries as separate spans. Work that happens later can’t do that, because the span that caused it has already ended — a scheduled action or a queued message starts a new trace with a link back to the work that caused it, and a ray ID ties the whole chain together.
Rivet assigns a ray ID for you, or you can set your own with the x-rivet-ray-id header or OpenTelemetry baggage.
Logs and traces
Every actor log line carries the actor’s identity and its rayId, plus traceId and spanId whenever a span is active. So a suspicious log line takes you straight to the trace it came from, and searching one rivet.ray.id pulls up every trace and every log for that request. See actor logs for the full log shape.
Workflows
Every workflow run is a separate trace linked back to the previous run, so a workflow that sleeps for a week is still one continuous story. Each step attempt is a span inside its run, and replayed steps aren’t traced again.
Your own spans
Spans you create with @opentelemetry/api nest inside Rivet’s spans automatically.
import { trace } from "@opentelemetry/api";
import { actor } from "rivetkit";
import { db } from "rivetkit/db";

const tracer = trace.getTracer("counter");

export const counter = actor({
	state: {},
	db: db(),
	actions: {
		query: async (c) =>
			tracer.startActiveSpan("counter.query", async (span) => {
				try {
					return await c.db.execute("SELECT 1 AS value");
				} finally {
					span.end();
				}
			}),
	},
});
Sampling per actor
A busy actor can produce a lot of spans. Set a sample rate for an actor and override it per action. Action names are type-checked.
import { actor } from "rivetkit";

export const orders = actor({
	tracing: {
		sampler: 0.1,
		actions: {
			placeOrder: 1,
			poll: 0,
		},
	},
	actions: {
		placeOrder: async (c) => {},
		poll: async (c) => {},
	},
});
Actors without a tracing config fall back to OTEL_TRACES_SAMPLER.
SDK support
- Rust (
tracing): fully supported - JavaScript (
@opentelemetry/api): fully supported - Effect: coming soon, use
@effect/opentelemetryin the meantime